Midterm
Oct 17, 2017
Skunk Mapping Project Documentation Post
For my midterm, I wanted to create a project that mapped something around the Bennington campus.
I was really inspired by the Mapping’s Intelligent Agents reading found here. I was interested in its ideas about people and animals as agents of mapping and data collection, and of having differing perceptions.
I decided to attempt to map moments in which Bennington students have come across skunks. There has been a bit of a hubbub around skunk spottings this term (it didn’t seem like as big of an occurrence last year, although that may have just been me!) I’ve seen two so far, and talked to lots of people who have seen a skunk. I wanted to see what we could learn about the skunk(s?) from just knowing when and where people have seen them. It also, interestingly, shows us the places that students are at night to some extent.
Originally, these were the features I wanted my map to have:
- Easy to look at
- Custom skunk icons
- More thought put into small style details such as font and color
- Legend which allows user to toggle sighting by date and time
- Some kind of feature which would allow an external user to place skunk data to be seen by everyone on the map
I was also concerned about getting community engagement in order to have enough data to display and get an impression from. A good portion of the work I have done for this has been getting input on what the most efficient and comfortable way to get data from people would be.
Some ideas I had for getting skunk spottings from community members included tabling and asking people in-person, distributing paper forms, and having some online method of submission.
I ended up creating a [google form] (tinyurl.com/btonskunk) and getting the word out to people by having a friend post it on a Bennington student facebook group. I wasn’t expecting this to get a lot of engagement, but within the first 24 hours I had about 30 data points from people filling out the form, and after ~1 week I have about 50.
This form has only really reached the student community at this point. To further data collection from different perspectives on campus, I have designed a poster to get the link to everyone on campus, such as faculty, people who do not have facebook, staff, and especially campus safety, who patrol at night and I’m sure have seen plenty of skunks. If I can find a way to make data entry for this project more efficient, I’d definitely try to implement it.
The google form does not record the email address or any personal information of the submitter and is not limited to people with Bennington email addresses. I wanted to keep the form anonymous, even though it might give some data less credibility and make it hard to clarify with people if I don’t understand something they write. I didn’t want there to be a barrier for people who would prefer to just contribute data and might feel less inclined to contribute if their email/name was recorded.
In order to translate the submissions into points on the map, I have been hand-entering the points into geojson.io, estimating how to place them based on the streets. I have been adding the data for date and time, putting “unknown” for sightings that have ambiguous dates or the submitter didn’t remember. I’ve been keeping the description text in there as well, for ~flavor~. Some of them are kind of funny!
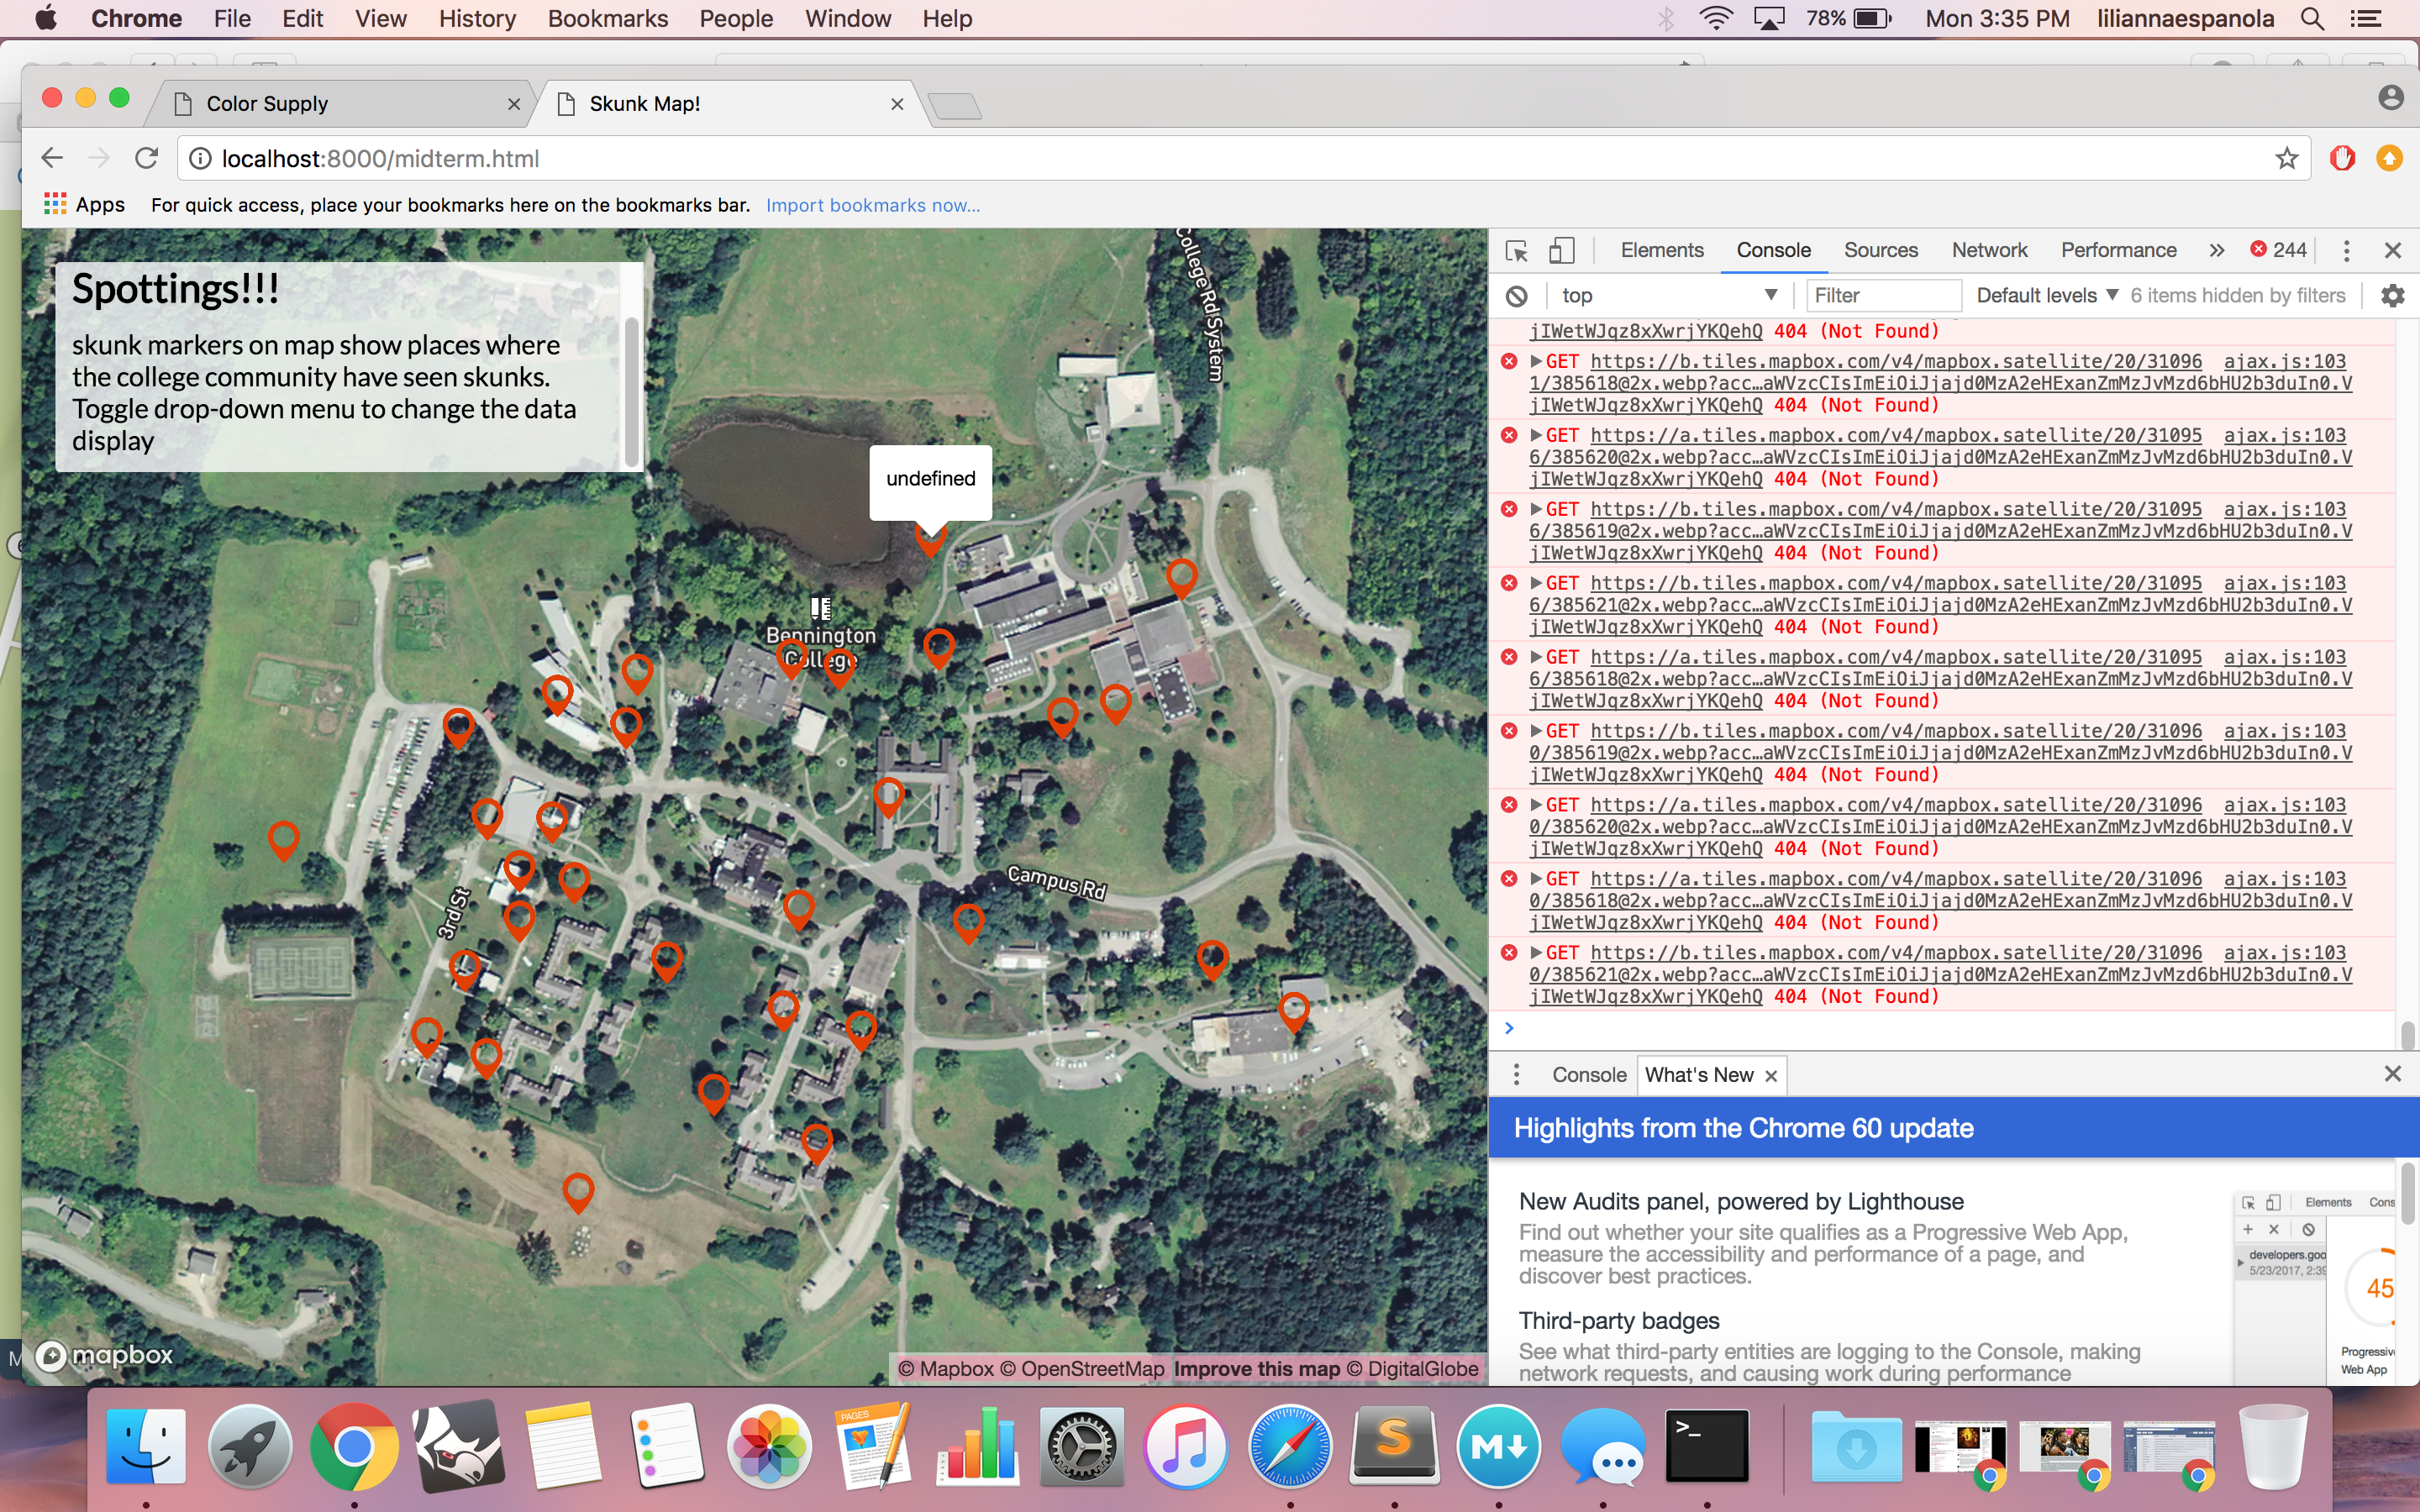
For the tiles, I chose to use mapbox’s satellite tiles. This is partially because mapbox’s styles don’t have building data for the Bennington campus and would have made the map really hard to read. So, my way around that was to just use the satelite, which might make it more visually complex but helps to check that I have placed things in the right place for data points that are like “I saw it by this specific tree”. This has been a bit of an issue though, (shown in the image below) since the coordinates are very specific they’ve been clustering at higher zoom levels, and the satellite view doesn’t get more detailed past a certain zoom level. So I wonder if there’s a way to switch tiles between zoom levels? Alternatively, I can use the satelite view to approximate the buildings and make a separate geojson layer of buildings on campus and just use a different tileset. Right now, I have it using the satelite tiles, which takes away from the complete visual coordination I was aiming for at the beginning, but oh well.
So I wanted the popups to display the description, and then on a separate line that told the date and the time, but I was having trouble getting the line break in there so instead made a drop-down that lets the user switch between the “flavor text” that describes each point and the date and time data for it.
Right now, I don’t have a way to get people to place things directly on the map, and my geojson data displays a little bit off for some reason? If I were to keep working on this, I would also add a way to filter by date and time.
Share